Making your soil rain-ready (part 1): Skywatchers, it’s time to look down
It’s been a “funny old year” – from the wet, water-logged winter-spring to the dry spring-summer. During the prolonged dry spell, people were watching the sky and “praying” for rain (or at least hoping). I wanted to share some relevant gleanings from visual assessments of soil structure and how they pertain to soil moisture, in these most “drying times”… To conclude, I will attempt to show how these observations could be brought-to-bear on management decisions now, and in the future; with a view to ensuring your soils are “ready for the rain.”
Below are some images of soils under different management. When looking at these images I want you to ask yourself: What can we see here? What is the appearance (the structure of the soil) telling us?
Observation
The first and perhaps most important point is to make a clear distinction between observations and conclusions (or cited causes). Not that we shouldn’t draw conclusions, simply that there may be multiple reasons for an observed phenomena. But the first step to understanding a given situation is observation.

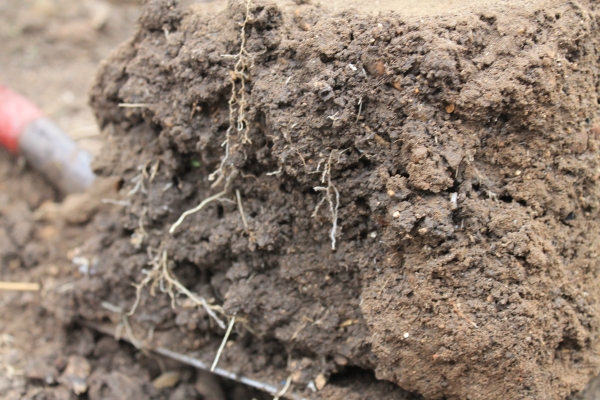
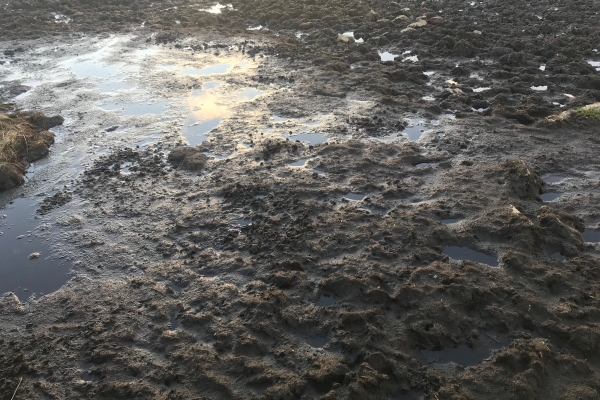
Above is an image of a soil under permanent pasture in mid-winter.
Q: What do we see in this picture, in terms of the visual appearance of the soil structure?
A: A tale of two (very distinct) layers
So, what, might we say, is the most important difference in the state of these two layers?
1. The upper layer appears darker – it is wet (or well hydrated), and;
2. the lower layer has a lighter appearance – it is dry.
Soil structure
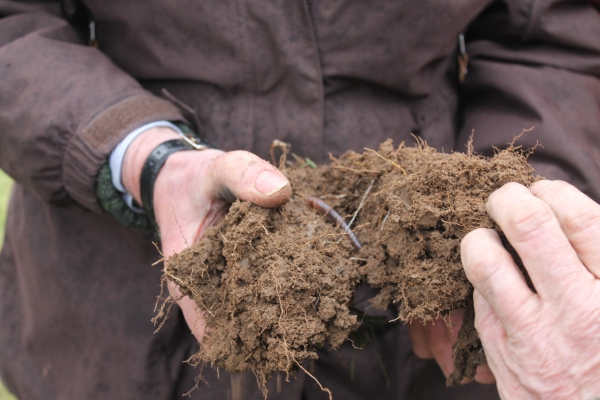
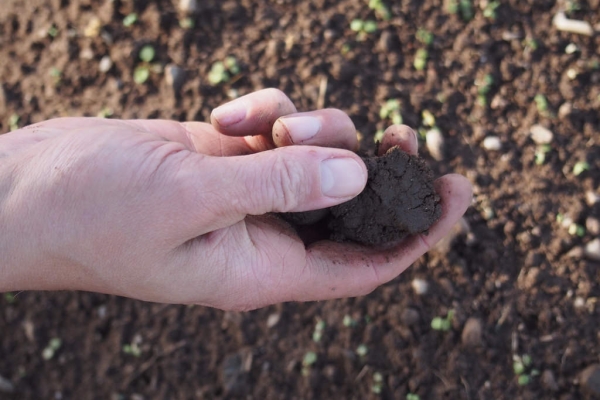
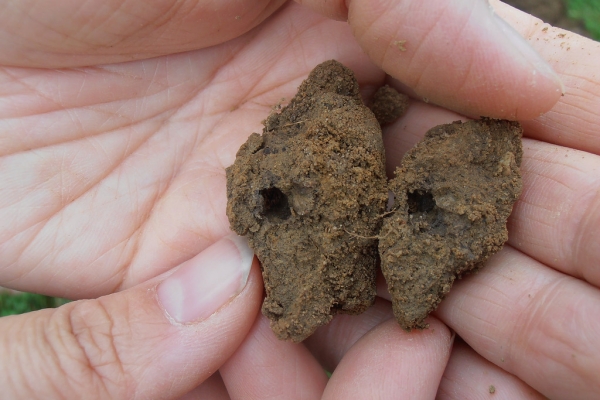
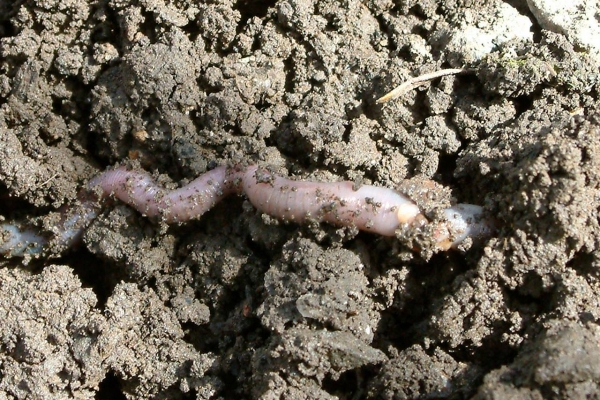
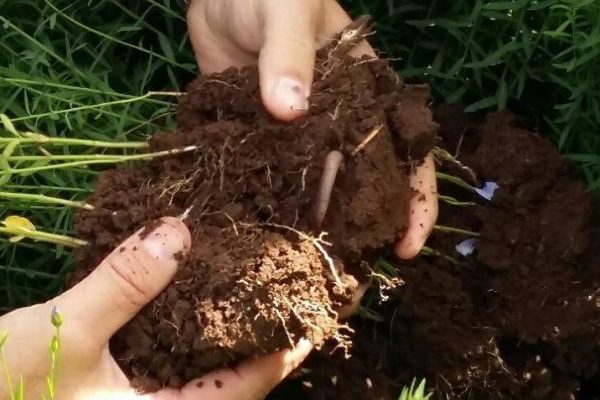
If we look at little more closely are there any other aspects of the appearance we can identify? Well, structure is one of the macro features of soil we can look to to judge it’s condition and it’s state of ‘health.’ The two broad categories of soil structure are aggregated and consolidated. Consolidated soil is the product of physical bonding, typically, having a uniform and homogenous structure, with angular or blocky sections. An aggregated soil is very different, it’s structure is a result of a biological activity – the secretion of sticky substances that glue the separate soil particles (sand, silt or clay) into little globs, that have a rounded appearance (they look like mini worm castings). See below for an example of an aggregated soil.

A closer look
By getting right in there we should be able to spot relevant, features or characteristics, not otherwise visible. Let’s look at these two layers separately, and see how they can be characterised in terms of their structure…

Upper layer
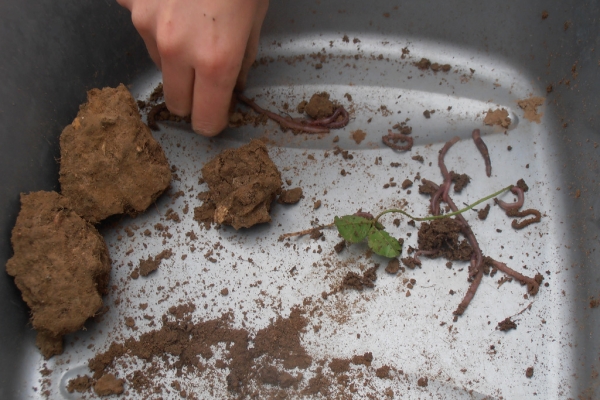
The upper layer (or turf layer as we might call it) has a more aggregated structure. We can see this because the particles sizes vary. They are generally small, have a ‘crumb-like’ structure, and are held apart from one another, in a disordered kind of arrangement. Overall, the structure is non-uniform, irregular and generally open in nature (this can be seen by the large number of small shadows visible in the image). This is also where the majority of the roots are concentrated. They are densely distributed and are mostly coated with soil, with some showing signs of ‘rhizosheaths’; groupings of soil which adhere to roots and which have improved water and nutrient uptake. These are all signs of biological activity (or the bi-products of microbial activity).
Lower layer
The section of soil below the turf layer has a quite different appearance. Rather than shadows everywhere from all the nooks and crannies created by the many discrete soil particles, what can be seen is a fairly solid mass, with distinct faces, broken into large angular sections. Between and within these sections there are cracks, clearly visible. Generally, where it does break breakdown in to smaller fragments, these are still angular and blocky in nature, rather than rounded. There are roots present throughout this layer, however they are fairly widely distributed and mostly white in colour – indicating they are ‘clean’ and free of soil… not a good sign as it means the roots aren’t building lots of aggregates. These visual cues are all indicative of a physical structure, one where the soil particles are bonded in crystal lattice; highly ordered, tightly packed and densely arranged, having a low porosity.

Discussion
We can see clear a distinction between these two different soil strata or layers, but what is the significance of these observations?
Hydration
The land has had ample rain so why isn’t the whole of the soil profile hydrated? If it were water loss due to evaporation (somewhat unlikely in winter), surely it would be the upper layer that would be dry, either through direct losses or through transpiration from the majority of the roots? If it were lack of precipitation we should see a proportion of the lower lever showing signs of hydration, yet there is a distinct boundary, exactly where the soil structure changes. What seems most likely here is that the rain that has fallen on to this soil has been unable to percolate into these lower depths, basically ending up moving laterally, and leaving the land (taking some goodness with it).
Why is this significant? Why should we care?
Well we can can say, that, amongst other things, soil is a water store (a reservoir) that holds water from rains (or snow melt) from which plants can draw on in dry periods. Generally, we can say that better aggregation allows more water to enter the soil profile and holds more of that for later in the year. This is shown in this example because the upper layer of this soil is well hydrated, and is also well aggregated, as opposed to the bottom which is dry and has a consolidated structure. We can broadly say that this layer and below will hold (and therefore offer) little water to plants come the growing season. In a drought this maybe the difference of several weeks of additional growth.
We can also broadly say that a better hydrated soil will have more active microbial populations, and thus more microbial activity, meaning more nutrient release, and therefore healthier, more nutritious grass plants. Which means healthier, better nourished animals, with better weight-gain, higher conception rates and improved meat quality – beneficial all round.
Response
So how are we to respond these observations? What practices or measures can we put in place to address these issues? What might our objectives be, based on what we can see? Where would we want to end up, over what period?
We can say that these observations are generally associated with poor pasture condition. Either through historic management practices or through some issue associated with cultivation, back in the day. There is no one right response. Every farm is different and you have to work with the constraints you have. However, whatever response you do try, it is important to monitor as you go so you can see if it’s working.
Sampling
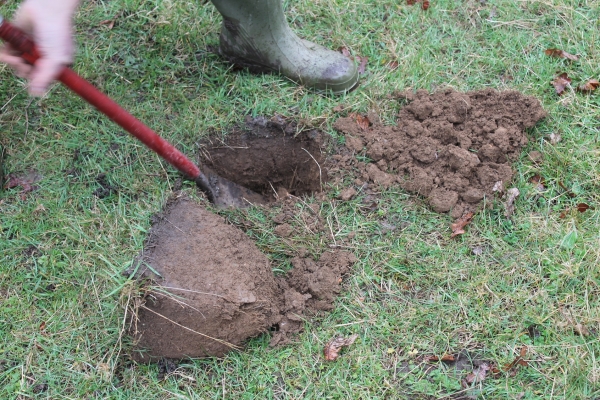
That said, it’s important to note that the image referred to here is just one sample and as such may not be representative of the whole field. To get a more accurate picture of the soil condition in a field as a whole, a number of samples should be taken, or an attempt should be made to return to the same spot each time samples are taken. Either way, the important point is that samples are representative.This soil sample has been selected for this piece because it illustrates a point clearly.
Monitoring
With this in mind, we can use the baseline we have from the samples we take, record a measure of topsoil depth – typically the upper layer, with more aggregated structure (potentially the turf layer), and look to increase that depth year-on-year; perhaps using a yearly, or twice yearly assessment – ideally taken from the same, or close to, the same location in that field. The VESS test will also be appropriate for referencing progress/improvements.
Another, more immediate method for measuring success would be forage volume, either with a plate meter or a sward stick, with increasing totals and faster growth rates being valued.
Finally, perhaps the most direct method for assessing water penetration into soils, is the water infiltration rate test, which is really a measure of aggregation - since as aggregation improves, so does infiltration. It couldn’t be more appropriate for the droughty July 2018.

Soil health principles
Once you’ve decided how you will measure success, the next step is to identify interventions/management practices that can help you achieve your objectives. These may well be novel practices or represent a change in management, as such there’s some consideration to be made when selecting a specific option. So, what’s useful is to have a criteria against which to make your selection.
One tool for making selections (or at least shortlisting) is using the soil health principles below. Basically, practices that match more of the soil health principles should be favoured (where practical).
- Living root – for long as possible, as often as possible
- Covered soil – with residues or living plants (leaves)
- Minimise disturbance – tillage/cultivation
- Diversity – in your rotations or mixes
- Feed soils – organisms need energy (carbon) to live and be active
- Incorporate animals – ideally using adaptive/planned grazing techniques
- Minimise use of chemicals/synthetics – undoes your good work above
In almost all case, if improving soil health is your aim, then the main objective is to increase microbial activity, either by feeding the organisms directly or by inducing the grass plants to grow larger and more rapidly (which has the knock-on effect of feeding soil biology also, through exudates).
In general we’re looking to increase residues and residuals, increase trampling and shifting to a lower (or ultra-low) utilisation rate – potentially 10-20%, with 30% being an upper range. Frequent moves and high stock density will facilitate these goals. See my next blog posting (part 2) for details…
Conclusion
This is a short expose on the process you might go through to assess underlying soil health issues and what steps you might take to address or remedy these issues. There is always more than one way of doing things, I would be wary of presenting any of this information as anything other, simply that it starts with what can be observed directly, what that tells us about the health of the soil, how we can measure this, and implementing management changes to address the underlying causes of these issues. This was particularly pertinent during the recent drought period as everyone was “running out of grass” (in a year when winter rains were, if anything excessive).
The basic premis is that a healthy soil will soak up all the rain the winter throws at it, let much of that pass through slowly, thus eliminating flood pulses, but holding the remainder (interstitially) where it can be accessed by crops and pasture plants for growth into hot dry spells (when they can grow best), giving longer growth. Healthy soils irrigate crops in drought – by capturing & storing rainwater.
If you have any thoughts or questions, please get in touch.
Niels Corfield is a consultant specialising in on-farm trees, soil improvement and integration. Contact: info@nielscorfield.com or @niels_corfield
Watch this space! Part 2; ‘Time to look ahead’ will be published next month…
(Editor’s Note)
All photos courtesy of Niels Corfield, All Rights Reserved.
Author:

Published date:
22nd August 2018Related farming theme:
Key Farming Practices:
- Soil monitoring
Organisation(s):
Related articles